Building evidence
Developing questions
Consider inviting community members to contribute to the model development. Think about a logic model as a “living” document, flexible, open to different perspectives, and changing as the program grows and changes too.
Logic model discussions can help spur evaluation questions about the process, activities, or outcomes of programs. We also may want to think about who the program serves, and how we might document adaptations if we are adopting a program developed elsewhere.
Note from la cocina: Why would we adapt programs?
Even though we typically think of recipes working best when we remain faithful to the original recipe, in practice we are in the process of adapting all the time. For instance, we might have a feeling teens and adults like their plate spicy, but we leave out the hot stuff for the younger children.
Collecting, analyzing, and interpreting data
Community members and staff are wonderful resources for determining how to best collect data, because they often are very familiar with the barriers to data collection, such as time and childcare needs.
On the other hand a common challenge in participatory evaluation is engaging community members and other members of your evaluation team in data analysis and interpretation. An evaluation consultant will have training in social science research methods and can add helpful skills to your team, but that doesn’t mean you can’t include others in these important steps of the evaluation. In this section we present two strategies to make the analysis part of the evaluation more inclusive. Overall, holding participatory data analysis meetings is a way to engage all stakeholders in making sense of the data you collect.
Participatory evolution tools: Word for qualitative data analysis and visualization
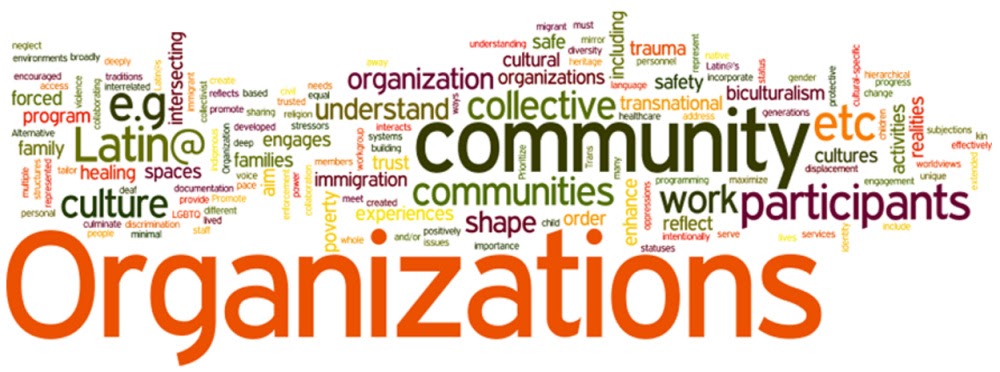
Qualitative data from focus groups or interviews usually results in clumps of data. Whether it is in the form of transcripts or open-ended responses to a survey you administered. It can seem overwhelming to make sense of such data. A good starting point is to use the Wordle tool which can help you see what themes emerge from the data. The themes are represented by text size based on the frequency they appear in a particular post. For qualitative data analysis, this tool can be used to establish initial codes for further analysis of the data. For stakeholders, it can provide immediate insight into relevant themes that may emerge from the data prior to waiting for the in-depth analysis.
For example, a Wordle of the Cultural-Specific Principles, revealed the following Wordle:
Participatory evaluation: Visualizing quantitative data with Excel
You can use PAR for collaboratively exploring quantitative data. Once data has been collected and the results have been generated, community members and other members of the evaluation team can provide valuable input in helping make sense of evaluation findings. As the team reviews data, you can create printouts or slides of pie charts, bar graphs, and other visual representations of data. Evaluators share data, guiding the discussion with program staff and other stakeholders. Questions to guide discussion may include the following:
- Is there anything that surprises you about the data?
- Why do you think we are seeing these (differences/similarities) in responses?
- How would you explain this finding?
- What recommendations would you make for our program/organization based on these findings?